Monitoring
PILOS comes with a simple user interface for monitoring the application, server and queue workers. Administrators can access the monitoring UI via the 'System Monitoring' menu item.
Metrics
PILOS provides a set of metrics that can be used to monitor the application. These metrics are available via the /metrics endpoint and can be scraped by Prometheus or other monitoring tools.
The monitoring endpoint is unprotected and can be accessed by anyone who knows the URL. It is recommended to protect the endpoint with a reverse proxy using an IP allowlist or basic authentication.
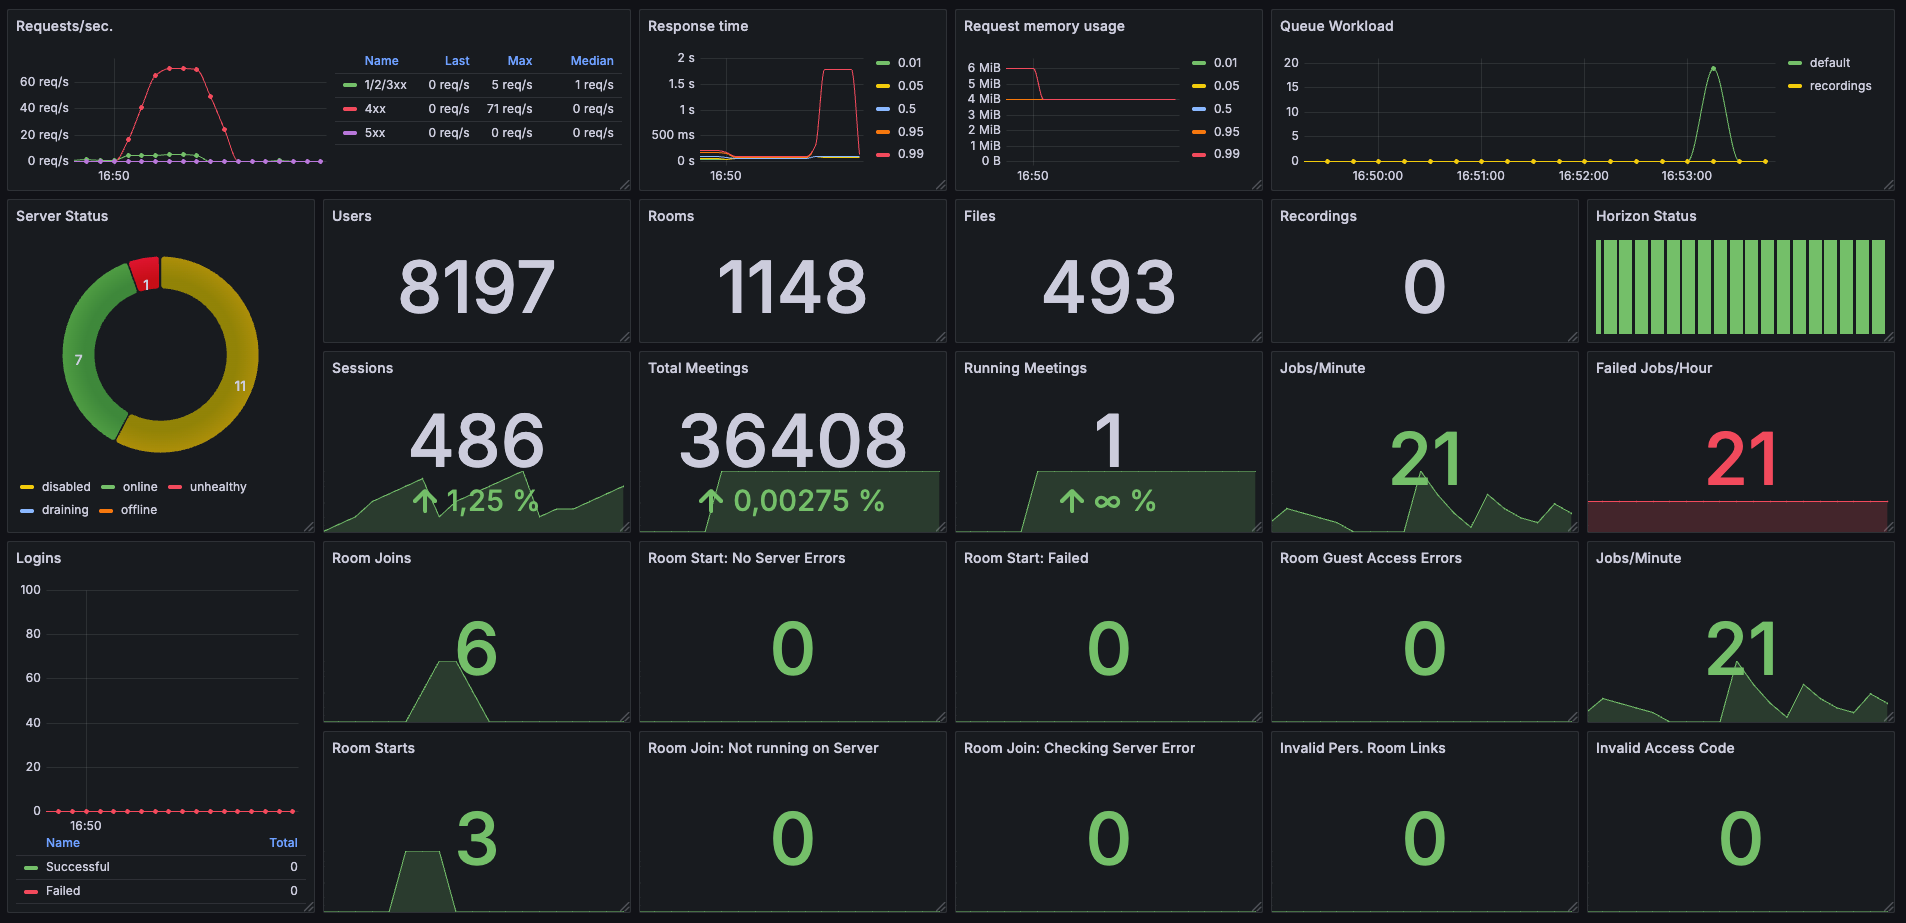
Grafana Dashboard
The metrics can be visualized using Grafana.
You can import the PILOS Grafana Dashboard to get a pre-configured dashboard for monitoring PILOS
or create your own dashboard using the metrics provided by the /metrics endpoint.
Configuration
| Option | Default Value | Description |
|---|---|---|
METRICS_ENABLED | false | Enable the metrics collection and endpoint |
METRICS_NAMESPACE | pilos | Prefix for the metrics |
METRICS_COLLECTOR_REQUEST_MEMORY_ENABLED | true | Collect the memory usage |
METRICS_COLLECTOR_REQUEST_MEMORY_EXCLUDE_ROUTES | metrics | Comma separated list of routes that should be excluded from memory usage collection |
METRICS_COLLECTOR_REQUEST_DURATION_ENABLED | true | Collect the request duration |
METRICS_COLLECTOR_REQUEST_DURATION_EXCLUDE_ROUTES | metrics | Comma separated list of routes that should be excluded from request duration collection |
METRICS_COLLECTOR_REQUEST_TOTAL_ENABLED | true | Collect the total number of requests (per response code group: 1xx, 2xx, etc.) |
METRICS_COLLECTOR_REQUEST_TOTAL_EXCLUDE_ROUTES | metrics | Comma separated list of routes that should be excluded from total request collection |
METRICS_COLLECTOR_STORAGE_ENABLED | true | Collect the available space and free space of the storages (per storage: local, recordings, recordings-spool) |
PHP-FPM Monitoring
The php-fpm status page is available from container port 81 and the url /status.
You can forward the port to the host by adding the following line to the docker-compose.yml file for the app service:
ports:
    - "127.0.0.1:9000:81"
If you like to monitor php-fpm using Prometheus and Grafana, you can use the hipages/php-fpm_exporter:latest container.
Add the following service to the docker-compose.yml file:
monitor:
    image: hipages/php-fpm_exporter:latest
    restart: always
    ports:
        - "127.0.0.1:9253:9253"
    command: "--phpfpm.scrape-uri=tcp://app:81/status"
You can configure a reverse proxy to expose the container to the public, add password protection, configure prometheus and grafana to scrape the metrics and create dashboards.